


- Home
- Product
- About Us
- Lost Foam Casting Process
- Lost Foam Casting Video
- Success Case
- Contact Us


If you are responsible for a lost foam pattern drying system, a casting line, or a foundry layout, the hardest question is usually not “how to dry patterns,” but “how much drying area capacity do we need to match daily output without creating bottlenecks?” This guide is written for production managers, process engineers, plant planners, and lost foam foundry owners who need to convert daily pattern output into a practical drying-area plan. It solves the common problems of overbuilt space, underbuilt space, uneven moisture removal, and unstable takt time. In many projects, the real cost is not the dryer itself, but the mismatch between pattern throughput, residence time, and floor-space utilization. With daily pattern output planning, drying area sizing for lost foam patterns, and pattern residence time calculation as the core framework, you can build a drying zone that supports process stability, airflow distribution, moisture diffusion, and capacity balancing. Ruiou has seen this problem repeatedly in plant upgrades, and the answer is almost always a data-based layout rather than a guess. 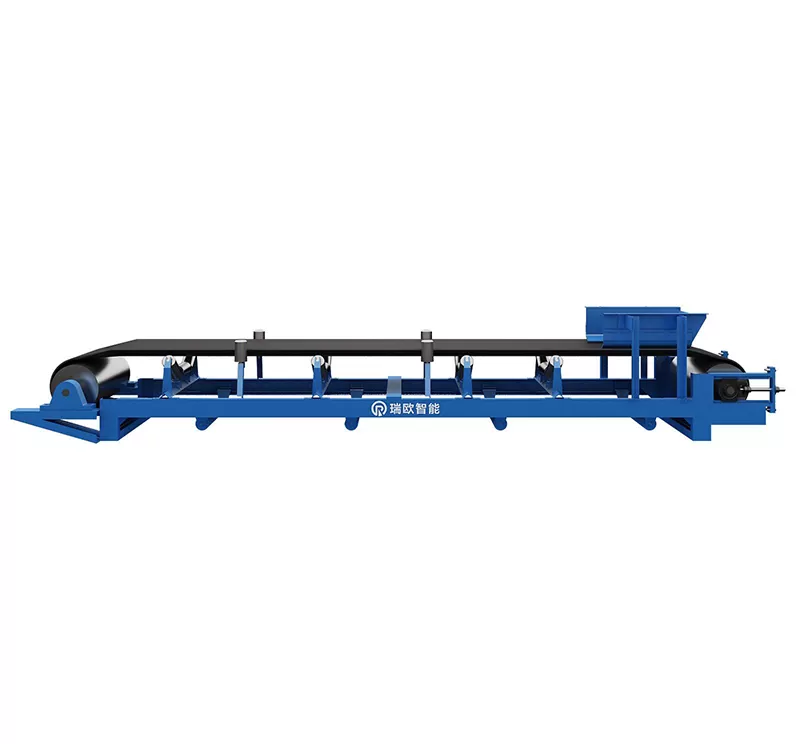
Drying area capacity is the buffer that keeps pattern production moving at the same rhythm as molding, coating, and assembly. In lost foam production, wet patterns or insufficiently cured patterns can increase coating defects, surface collapse, coating peel-off, and dimensional drift. Industry practice shows that a coating layer with unstable drying often causes rework rates to rise by 12%–25%, while uneven air circulation can extend surface drying time by 18%–40%. If the drying zone is undersized, patterns accumulate on racks and increase handling time; if oversized, the plant pays for unused floor space, energy loss, and longer internal logistics paths. The right design uses daily output, drying cycle, and stacking density to calculate the number of racks, aisle width, and ventilation path. For a lost foam pattern drying system, this is not only a space issue but also a quality-control issue tied to residual moisture, heat transfer coefficient, and relative humidity control.
The formula is simple in principle: daily output ÷ effective turns per day = required drying capacity. But the engineering details matter. If a line produces 1,200 patterns per day and each pattern requires 6 hours of controlled drying, then one space can theoretically turn four times per day under continuous flow. In practice, loading, unloading, spacing, and inspection reduce the real turn rate by 10%–20%. That means the actual planning basis should be lower than the theoretical maximum. Plants that ignore this margin often discover, after startup, that the drying area can only support 75%–85% of planned throughput. A better method is to use a capacity coefficient that includes drying time, handling loss, and contingency buffer, especially for patterns with varying wall thickness or different foam density.
Lost foam pattern shops are sensitive to temperature fluctuation and air path disturbance. If the drying area is placed too close to a resin mixing station, solvent vapor or dust can interfere with surface curing. If racks are packed too densely, the boundary layer around each pattern becomes thicker and slows evaporation. Engineering data often shows that increasing aisle width from 0.8 m to 1.2 m can improve air exchange in the rack corridor by around 15%–22%, depending on fan placement and exhaust strategy. This is why the drying area should be planned as a controlled micro-environment, not just empty floor space.
Before you calculate the size of the drying area, it helps to understand the basic technical vocabulary. In pattern drying, the most important terms are residence time, mass transfer, air changes per hour, and thermal balance. Residence time is how long a pattern stays in the drying zone before reaching the target moisture level. Mass transfer describes how water or solvent moves from the pattern surface into the surrounding air. Air changes per hour measure how often the air volume in the drying room is replaced, which directly affects evaporation efficiency. Thermal balance refers to keeping temperature stable enough to avoid skin drying too fast while the internal moisture remains trapped.
From a process perspective, drying is governed by coupled heat and mass transfer. At the beginning, evaporation is usually surface-dominated; later, internal diffusion becomes the limiting factor. That is why fast surface drying does not always mean good overall drying. A pattern may feel dry to the touch while still retaining internal moisture that later creates coating defects or deformation. In many foundry environments, maintaining temperature within a ±2°C band and relative humidity below 55% can reduce drying variability significantly. Ruiou’s field projects often focus on these two parameters first, because they are more impactful than simply adding more fans.
Effective drying area is the actual usable floor or rack area after deducting aisles, inspection spaces, and dead zones. Stacking density refers to how many patterns can be placed per square meter or per shelf level. Utilization ratio is the percentage of total area that actively contributes to production. In many plants, utilization ratio is only 60%–70% due to poor layout. Raising that ratio to 80% can often provide the same capacity as expanding the building, without the capex burden.
Drying time is a process variable; drying capacity is a system variable. A pattern that needs 5 hours of drying does not mean the drying area can only process one batch every 5 hours. If the layout supports staggered loading, zoned airflow, and continuous rack rotation, the same area can support multiple turns per day. This is why planners should evaluate throughput, not just dwell time. The difference can be decisive: two layouts with identical drying time can differ by 30% or more in daily output support because of aisle design, access efficiency, and rack utilization.
Without this segmentation, capacity planning becomes misleading. A flat panel pattern and a complex ribbed pattern may share the same count, but their drying behavior can differ by 20%–35%.
For example, if a pattern needs 4.5 hours at controlled conditions and winter humidity increases drying time by 12%, the planning cycle should use about 5.0 hours. This avoids underestimating the drying-area demand.
If the shop runs 24 hours and the adjusted cycle is 6 hours, the theoretical turn rate is 4. However, if handling consumes 15 minutes each cycle and inspection adds another 15 minutes, the real turn rate may fall to 3.5 or lower. That difference must be reflected in capacity planning.
For instance, 1,200 patterns/day divided by 3.5 turns/day requires about 343 pattern positions in circulation. With a 15% buffer, plan for roughly 395 positions. This buffer is often the difference between stable operation and daily queueing.
In practice, narrowing aisles to save space can reduce handling speed and increase collision risk. A plant that improved aisle width from 0.9 m to 1.1 m reduced transfer delays by 18% in one Ruiou project because operators could pass racks without interruption.
Uniformity is the key performance indicator. If the temperature difference between top and bottom shelves exceeds 3°C, drying inconsistency can appear. If relative humidity varies by more than 8 percentage points across the room, moisture gradients often cause uneven surface curing.
A trial run is the fastest way to find hidden bottlenecks. Many plants discover that the effective capacity is limited by a single corner, door opening, or transfer point rather than the drying room itself.
Good planning is easier when you use the right tools. Common tools include a digital layout drawing, a moisture meter, a temperature-humidity data logger, an anemometer, and a simple spreadsheet or simulation model. For higher-accuracy projects, discrete-event simulation can estimate queue buildup, rack turnover, and utilization over time. Plants with mixed product lines can also use a product family matrix to assign different drying times and rack requirements by SKU. These tools help move the discussion away from opinion and toward measurable variables such as air velocity, evaporation rate, and process capability index.
One practical model is to calculate required area using three inputs: piece count, footprint per piece, and stacking factor. Then apply process losses. For example, if a pattern footprint is 0.08 m², stacking factor is 1.0 because the pattern cannot be nested, and the space efficiency after aisles is 65%, the real area per pattern position becomes about 0.123 m². Multiply that by required positions and you get a defensible layout number. This is much more reliable than estimating by eye.
Consider a plant producing 1,500 lost foam patterns per day. Each pattern requires 6 hours of drying at 26°C and 50%–55% RH. The operating window is 22 hours because 2 hours are reserved for cleaning and maintenance. The effective turn rate is therefore 22 ÷ 6 = 3.67 theoretical turns, but after handling losses the real turn rate drops to about 3.2. Required positions are 1,500 ÷ 3.2 = 469 pattern positions. With a 15% buffer, the plant should plan for about 540 positions. If each rack holds 18 patterns, the system needs 30 racks. If each rack footprint including access clearance is 1.6 m², the rack zone alone needs about 48 m², before adding inspection, staging, and airflow corridors.
In the same case, the plant initially planned only 360 positions and experienced daily queue buildup of 120–150 patterns. The result was delayed molding, higher operator movement, and unstable coating quality. After resizing the drying area and improving airflow, the queue dropped to fewer than 20 patterns per shift, and the rework rate decreased by 14% in the first month. This is a typical example of how correct capacity planning improves both throughput and quality.
Common signs include patterns waiting longer than one shift, inconsistent surface dryness, increased handling damage, and frequent schedule changes. If the drying queue regularly exceeds 10% of daily output, the area is probably undersized.
Use average output as the base and add a contingency buffer for peak output. Most plants plan 10%–20% above average demand. If seasonal humidity is high or the product mix changes often, use a larger buffer.
No. If the surface dries too quickly while internal moisture remains, defects can increase. The target is uniform drying, not maximum speed. In process terms, stability is often more important than raw evaporation rate.
The most common mistake is ignoring non-productive time such as loading, unloading, inspection, and transfer. Another frequent issue is using one drying-time value for all products when the shop actually runs multiple pattern families.
Once the basic capacity is correct, the next level is optimization. You can improve drying-area performance by zoning the room according to product type, using variable-speed fans to match load, and applying heat recovery to reduce energy consumption. Some plants introduce data logging to monitor temperature and humidity trends across shifts. Others use QR-coded rack management to reduce search and transfer time. These measures can improve utilization by 8%–15% and reduce energy per piece by 6%–12% depending on baseline conditions.
Advanced readers should also study psychrometrics, which explains how air temperature, humidity, and enthalpy interact during evaporation. Understanding the psychrometric chart helps you avoid the mistake of adding heat without removing moisture. In many drying systems, dehumidification can be more effective than temperature increase because it directly improves the vapor pressure gradient. This is where engineering detail matters more than intuition.
For companies planning a new line or upgrading an existing shop, Ruiou recommends starting with a site survey, process audit, and layout proposal before buying equipment. The right equipment selection depends on the actual drying load, not just the catalog specification. A photo, layout map, and output report can make the proposal much more accurate. If you are evaluating a new installation, the image below can also help your team align on the target concept and room arrangement.
Planning drying area capacity from daily pattern output is a production-control task, a layout task, and a quality-stability task at the same time. If your current shop has queue buildup, inconsistent drying, or low space utilization, the best next step is to move from rough estimation to measured capacity design. Recommended solutions include drying racks, controlled ventilation systems, humidity monitoring, layout optimization services, and full lost foam pattern drying system integration. Ruiou can support site evaluation, capacity calculation, and drying-area configuration so your line matches output without unnecessary floor-space waste. If you want to discuss your daily output, product mix, or plant layout, you can contact Ruiou for a practical plan tailored to your line.
In short, a well-designed drying area improves throughput stability, moisture uniformity, and layout efficiency. When daily output, drying time, and rack arrangement are calculated together, the result is a production system that performs predictably instead of reactively. With the right data, the right airflow, and the right capacity margin, the drying area becomes a controlled asset rather than a hidden bottleneck. Ruiou.




Copyright © Hebei Ruiou Intelligent Equipment Co., LTD. All Rights Reserved. | Sitemap | Powered by